

Join Our Telegram channel to stay up to date on breaking news coverage
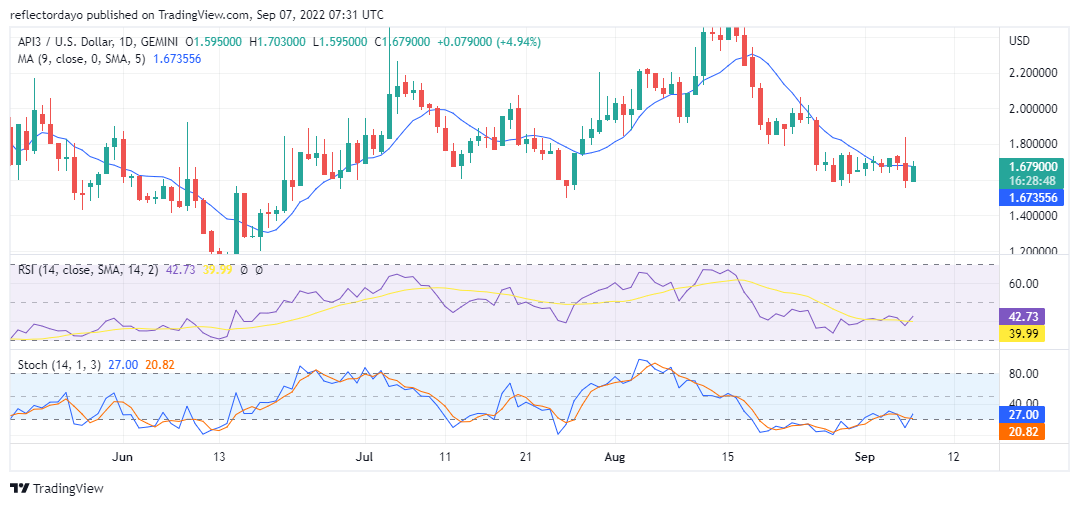
Sellers in the API3/USD have been in control of the market since mid-August. But since the first day of September, Buyers have also been making efforts to regain ground in the market. but their effort is just enough to keep the market range sideways. The bulls are not strong enough to regain their ground in the market. Looking back to price action from the 1st day of September till date, apart from times of total market gridlock between bulls and bears, all the victories that bulls had won did not last as Sellers keep stripping them of them. In the market yesterday, buyers initially took the price above the $1.800000 resistance level, but could not hold their ground. After buyers took the price to $1.827808 Sellers brought it down to the support level of $1.60000. Bulls are at it again today and currently, they have recovered the price up to $1.70000.
API3 Market Price Statistic:
- API3 /USD price now: $1.717000
- API3 /USD market cap: $ 97,077,140
- API3 /USD circulating supply: 56,547,601.00
- API3 /USD total supply: 113,912,052
- API3 /USD coin market ranking: #188
Key Levels
- Resistance: $1.800000, $1.900000, $2.000000
- Support: $1.600000 $1.5000000, $1.600000
Your capital is at risk

API3 Market Price Analysis: The Indicators’ Point of View
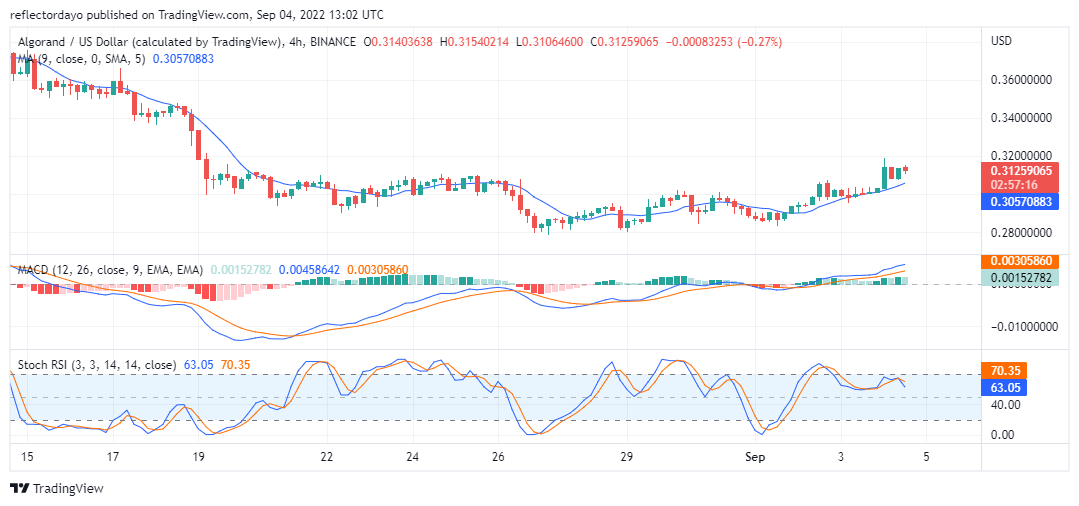
In the Moving Average Convergence and Divergence Indicator, we can see how strong sellers are impeding the price push of the buyers. From early September, the negative histograms show that sellers are losing strength as the buyers are gaining strength. The pink-coloured histograms are reducing in height as the day progressed, but yesterday, selling pressure suddenly became strong. The expectation is that the bearish move will continue today. but, So far in today’s market, we can see very strong buying pressure. But according to the RSI and the MACD, the price action is still in the weak zone.
API3/USD 4-Hour Chart Outlook
The RSI Signal line is moving on an almost horizontal level and also, In the MACD the two lines and the histograms are moving along close to each other. This is indicating a ranging market. However, if the bullish momentum continues, the market will switch from this short-term indecisive market trend to an uptrend
Related
Tamadoge – Play to Earn Meme Coin

- Earn TAMA in Battles With Doge Pets
- Capped Supply of 2 Bn, Token Burn
- NFT-Based Metaverse Game
- Presale Live Now – tamadoge.io
Join Our Telegram channel to stay up to date on breaking news coverage