


On the 20th of August, the BCH/USD market was in a total deadlock following a previous strong bearish market trend that was ended by a fruitless tug-of-war between demand and supply. The standoff between the buyers and the sellers resulted in that day’s stagnant market. This may be a sign that announces the end of the bearish market and the beginning of the bullish market. Here, on the chart, we can see the three consecutive candlesticks between the 21st and today 23rd. This has so far resulted in an 11.95% gain in the value of Bitcoin Cash.
Bitcoin Cash Price Statistic Data:
- BCH/USD price now: $131.72
- BCH/USD market cap: $2,523,100,720
- BCH/USD circulating supply: 19,153,268 BCH
- BCH/USD total supply: 19,153,269 BCH
- BCH/USD coin market ranking: #29
Key Levels
- Resistance: $155.73, $143.99, $131.82
- Support: $114.50, $134.50, $117.94
Your capital is at risk
Bitcoin Cash Price Analysis: Erratic Market Behavior
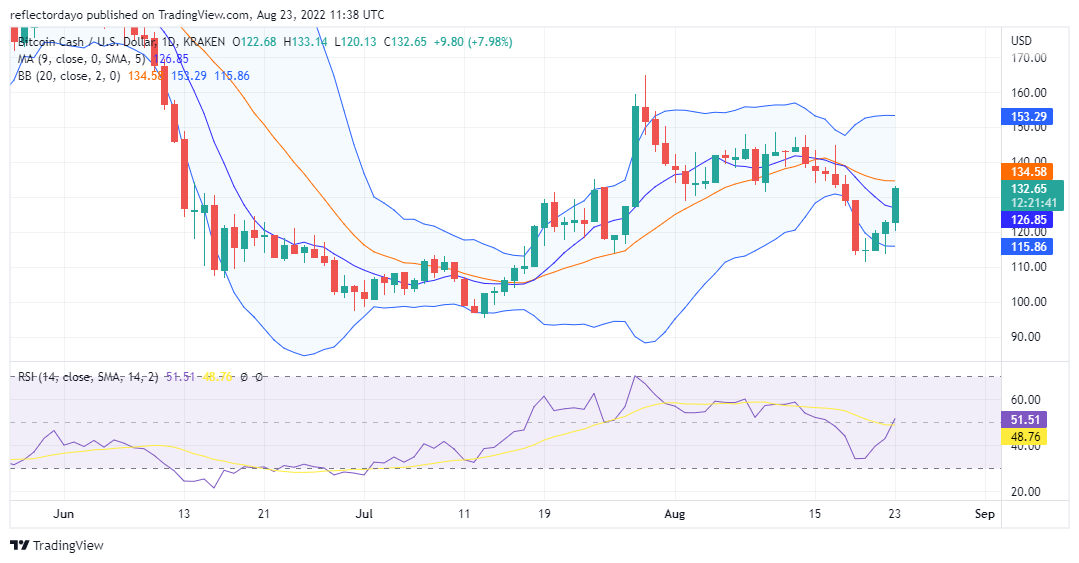
The outlook of Bitcoin Cash on the daily chart is an erratic market swing between the highs and the lows. For instance, the price rose to $155.73 from $127.10 on the 28th of July. That was a huge win for the bulls. But by the 19th and 20th of August, the value has fallen below the opening price of July 28.

Bitcoin Cash Price Analysis: The Indicator’s Point of View
Price action on the 28th of July shoots out of the upper boundary of the Bollinger band indicator. And also on the 19th of August, bearish price action shoots below the boundary of the Bollinger band. At the point of aggressive price action on the indicator, we can see that the width of the band expands which confirms that the market is erratic in its pattern of movement. On the RSI indicator, the signal line which is measuring 48% will soon follow the RSI line which is already 51%.
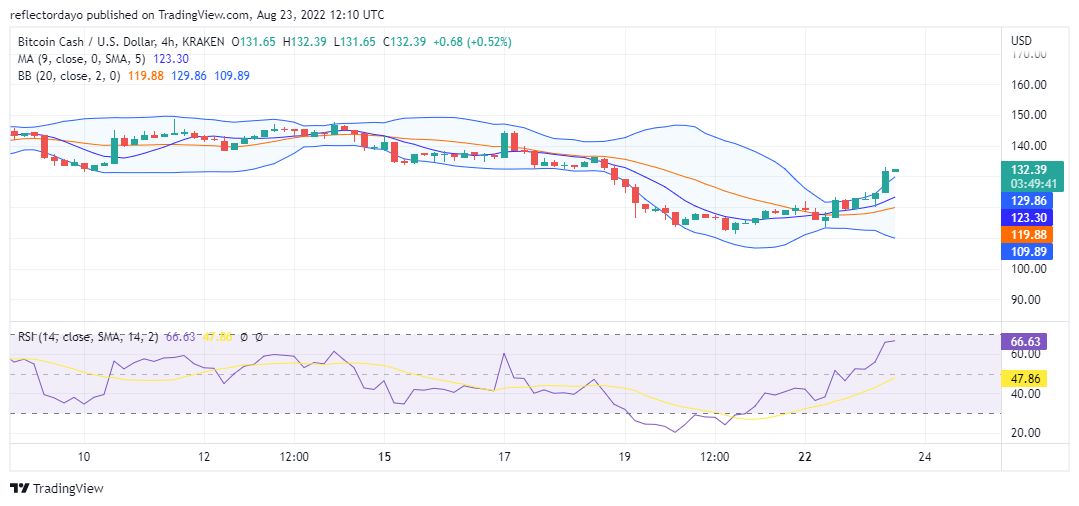
Bitcoin Cash Price Analysis: BCH/USD 4-Hour Chart Outlook
Both the Bollinger band and the RSI indicators are showing the aggressive moves of the bulls. RSI line is at 67%. If this momentum keeps increasing the price may enter the overbought zone. If that happens, the price will drop again. But for now, the price may likely keep increasing reaching up to $135.
Related
Tamadoge – Play to Earn Meme Coin

- Earn TAMA in Battles With Doge Pets
- Capped Supply of 2 Bn, Token Burn
- NFT-Based Metaverse Game
- Presale Live Now – tamadoge.io