
On-chain data shows both the Bitcoin taker buy and taker sell volumes registered large spikes over the past day as the price goes through volatility.
Bitcoin Taker Buy And Taker Sell Volumes Have Surged Up To High Values
As pointed out by an analyst in a CryptoQuant post, both the BTC taker buy and taker sell volumes hit more than $1.8 billion yesterday.
The “taker buy/sell volume” is an indicator that measures the Bitcoin long and short volumes on derivatives exchanges. The metric distinguishes between these two volumes based on whether the transaction occurs at the ask price (taker buy) or the bid price (taker sell).
When these volumes are high, it means the exchanges are receiving a large amount of orders right now. This kind of trend usually leads to higher volatility in the price of the crypto.
On the other hand, low values suggest there is little activity in the market at the moment, which can result in a more stale price action for BTC.
Now, here is a chart that shows the trend in the Bitcoin taker buy and taker sell volumes during the last couple of weeks:
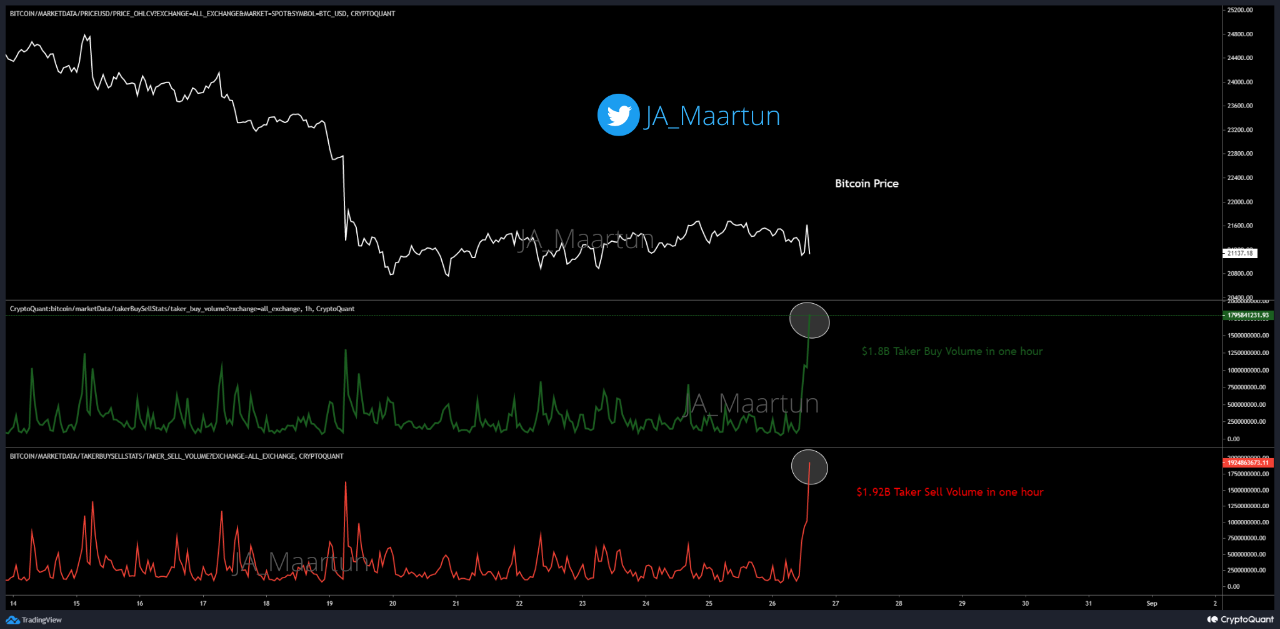
The values of the two metrics seem to have shown large spikes during the past day | Source: CryptoQuant
As you can see in the above graph, the Bitcoin taker buy and taker seller volumes have seen quite sharp increases recently.
These spikes have come just after the Federal Reserve chairman Jerome Powell delivered an interest rate warning in a speech yesterday.
The taker buy volume took just an hour to reach $1.8 billion, while the taker sell volume rose even higher at around $1.92 billion.
The value of Bitcoin observed a drop below the $20k level some time after this elevation in the market activity. Currently, it’s unclear whether this was it for the volatility or if the coin will continue to see more sharp price action in the near future.
BTC Price
At the time of writing, Bitcoin’s price floats around $19.8k, down 6% in the last seven days. Over the past month, the crypto has lost 6% in value.
The below chart shows the trend in the price of the coin over the last five days.

Looks like the value of the crypto has sharply declined over the last twenty-four hours | Source: BTCUSD on TradingView
After moving mostly sideways during the past week, Bitcoin seems to have broken out of the range today as the crypto has dipped below the $20k mark for the first time since the middle of July.
Featured image from Kanchanara on Unsplash.com, charts from TradingView.com, CryptoQuant.com