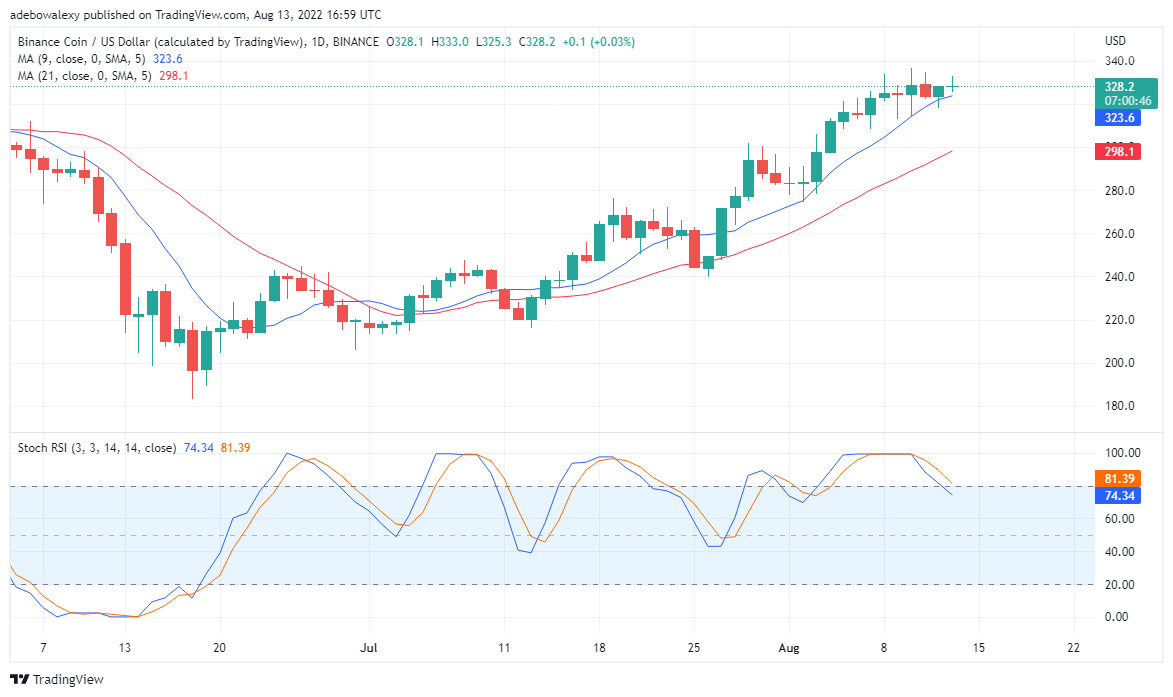
Binance coin has been experiencing a significant bullishness in its market. Looking back in time, as far back as around the 1st of August, we can see that the market has been mostly bullish. However, around the 8th of this month, it appears as if the bullish candles are already showing up more frequently.
Binance Forecast Statistics Data:
Binance current price: $328.2
Binance market cap: $52.7 billion
Binance circulating supply: 161.3 million
Binance total supply: 161.3 million
Binance Coinmarketcap ranking: #5
We need to study the signs given by the indicators on the BNB/USD chart to know what to expect in this market. Also, we’ll use these signs to give some useful trading decisions that could be taken. This analysis is aimed at helping traders to increase their trading profitability.
Key Levels:
Ceiling Levels: $318, $324, $328
Floor Levels: $326, $320, $316
Binance Coin Price Analysis: Buyers in BNB/USD Market Are Battling Hard
The latest candle on the BNB/USD chart portrayed the tough battle going on in this market. The appearance of a Doji candle on this is showing how much battle is going on here. Additional signs of weakness in this market are coming from the 9-day moving average. We can see that this line is getting too close to the price action. Should a bullish candle forms next, this will bring the Binance coin to lower support.
Additionally, although the price of candles stays above the MA lines, signs of trend reversal are coming from the Stochastic RSI indicator. Here, it could be seen that the lines of this Indicator are currently trending downwards. Consequently, this is significant proof that the current uptrend may have arrived at its end. Nevertheless, if more buying pressure is exerted in this market price may keep trending upwards. Subsequently, Higher resistance will be found at around $340.
Binance Coin Price Analysis: BNB/BTC is on a Strong Downtrend
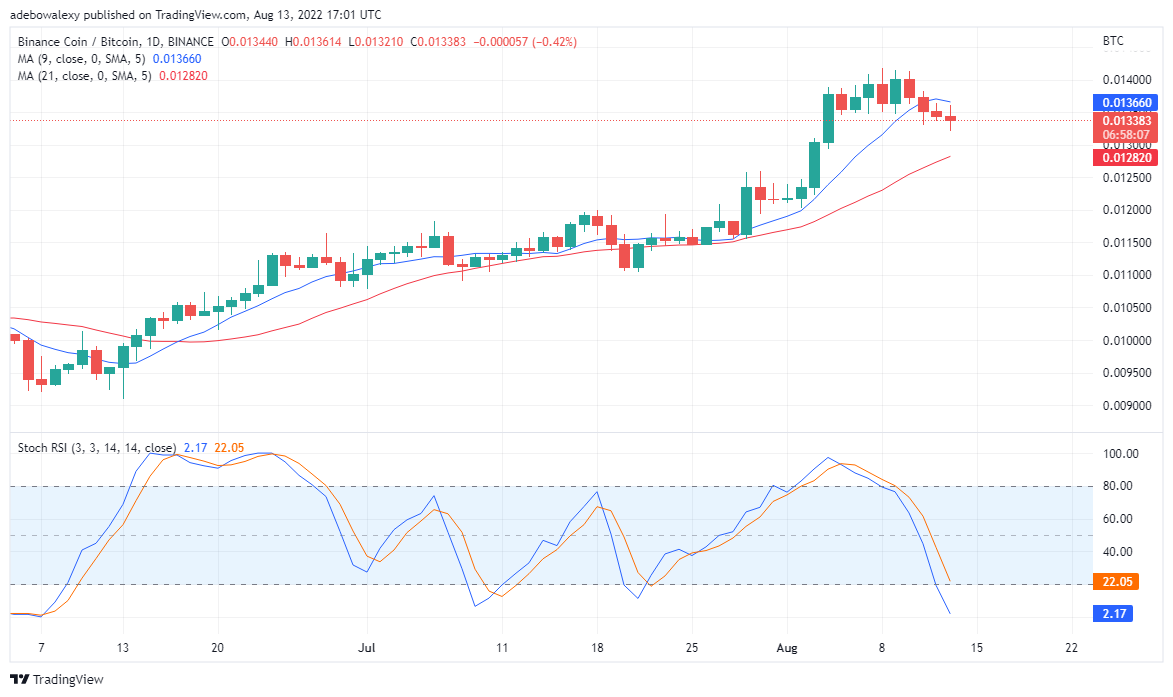
The BNB/BTC is convincingly bearish. In this market, bearish candles have been appearing since around the 10th of this month. Also, the 9-day moving average has already crossed above the bullish candles. Going by this, it is only a matter of time before the slower one crosses above the price action as well. Consequently, this would supply more strength to the downtrend.
Your capital is at risk.
Furthermore, the Stochastic RSI steeply plunged into the oversold area. Going by the level at which this Indicator curve has reached new support may be found around 0.012800. Be that as it may, Upbeats in the value of BTC will fuel the bears. Also, better performance of the BNB will restrain the bears or correct the trend upside.
Related
Tamadoge – Play to Earn Meme Coin
- Earn TAMA in Battles With Doge Pets
- Capped Supply of 2 Bn, Token Burn
- NFT-Based Metaverse Game
- Presale Live Now – tamadoge.io


