Determining the strength of the crypto market requires looking at more than just Bitcoin’s price. Addresses holding BTC as a long-term investment represent the foundation of the Bitcoin market and hold the fort in times of high volatility.
The amount of BTC held as a long-term investment can be determined by how often its circulating supply moves. The longer a portion of the circulating supply stays dormant, the stronger the market is, as addresses holding these coins often form a strong support for Bitcoin’s price.
Looking at Bitcoin’s supply that hasn’t moved in over a year shows what the industry likes to call diamond hands — the most determined hodlers.

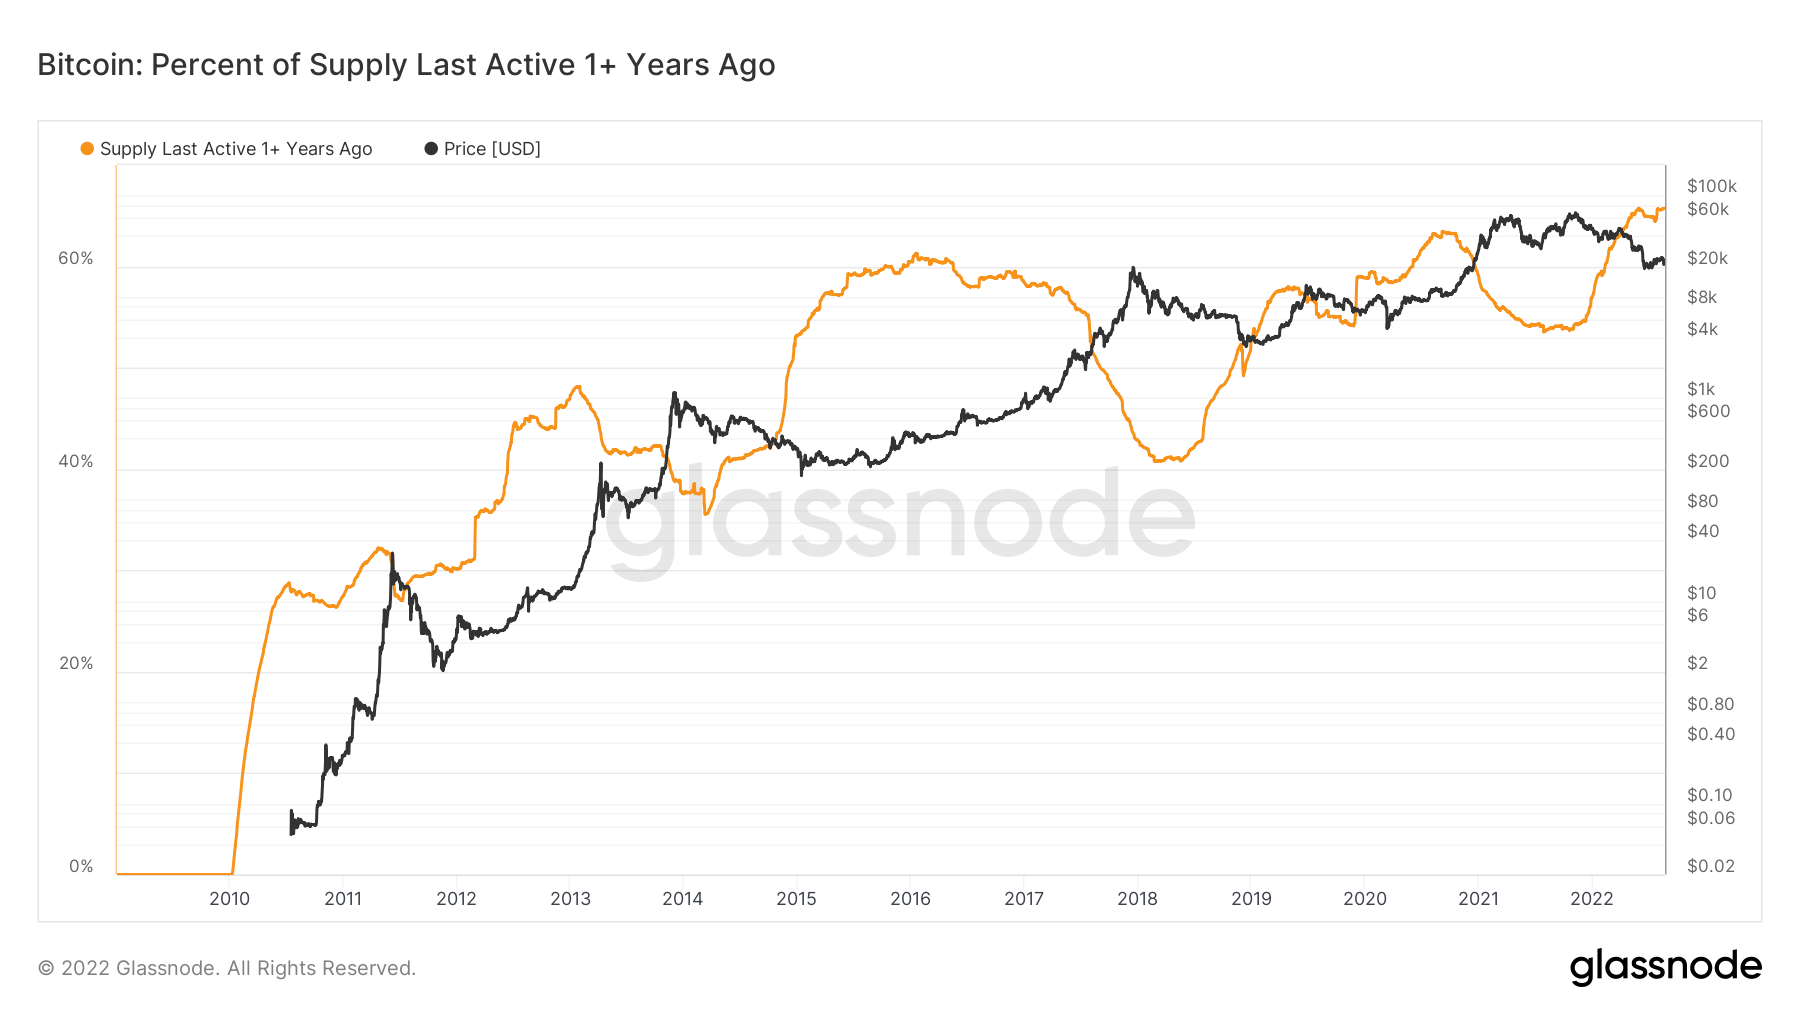
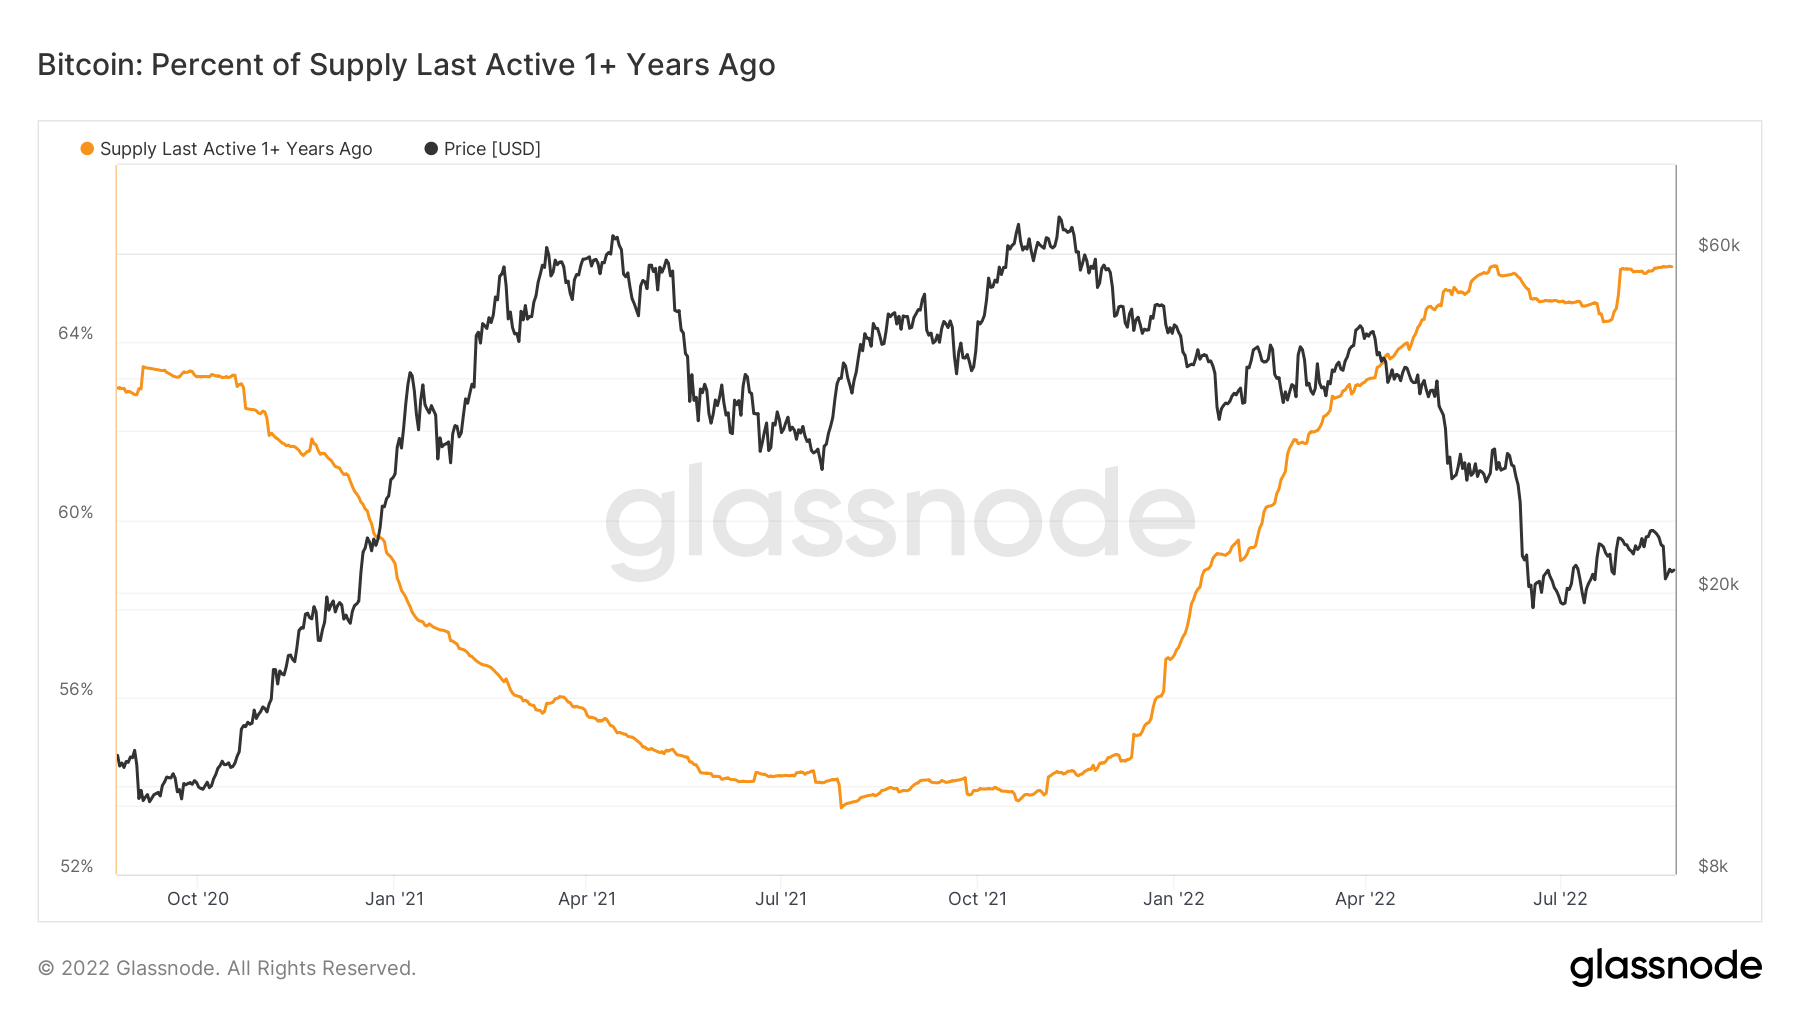
According to data from Glassnode, Bitcoin’s supply which was last active over a year ago, reached its all-time high this month and currently stands at 65.7%. The current percentage is even higher than the numbers recorded in May 2022, when the crypto market entered a period of unprecedented volatility.
The fact that 65.7% of Bitcoin’s supply remained dormant for over a year shows that a record number of addresses continue to hold their coins during the bear market.
The data also indicates that the majority of the supply now lying dormant was accumulated between May and July 2021. At the time, Bitcoin’s price took a heavy blow as almost all large miners were forced to shut down their operations and move out of China. Accumulating BTC in stressful and uncertain times shows firm conviction in the market that seems unshaken by downward price movements.
The only time the market sees these diamond hands exiting their positions is during bull runs. The accumulation and distribution cycles that take place during bear and bull markets further corroborate this.
The latest market downturn wiped out almost 75% of Bitcoin’s price, destroying any potential profits these older coins could have made. However, during bear market cycles, addresses holding coins for over a year almost always refuse to sell at a loss and choose to weather the storm until the next bull run.
When the bull market does arrive, these addresses are the ones distributing their tokens to realize a profit.


