

Join Our Telegram channel to stay up to date on breaking news coverage
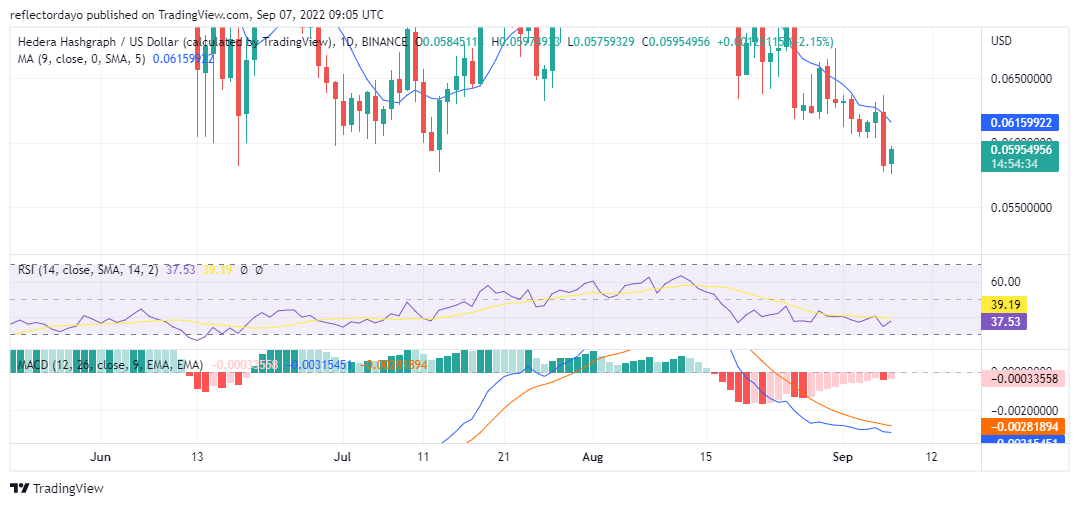
As the market of HBAR/USD trends downward, buyers keep making effort push the price to the upside. In today’s market session, we can see that the buyers are at it again as they are trying hard to impede the bearish progress. In this market, bulls are not as strong as the bears. The buyers aggression is obvious as we observe the behaviour of price on the chart. For instance, yesterday, the buyers attempted to continue on the bullish momentum. They push price to $0.06369831, but sellers brought the price as low as $0.05820038.
Hedara Hashgraph Market Price Statistic:
- HBAR /USD price now: $0.05962615
- HBAR /USD market cap: $ 1,254,775,922
- HBAR /USD circulating supply: 21,000,000,000
- HBAR /USD total supply: 50,000,000,000
- HBAR /USD coin market ranking: #40
Key Levels
- Resistance: $0.0600000, $0.06300000 $0.06500000
- Support: $ 0.0587782, $0.055555167, $0.0550000
Your capital is at risk

Hedara Hashgraph Market Price Analysis: The Indicators’ Point of View
In the MACD, the two lines, have cross to the side of the negative histogram. The significance of this is a very strong bearish momentum. However, the Pink coloured and reducing height of the histogram shows that the bulls are trying to recover the price to the upside. Since the first of September, they seem to be making progress day by day as the histogram keep reducing. But yesterday was an exception as the selling pressure was strong.
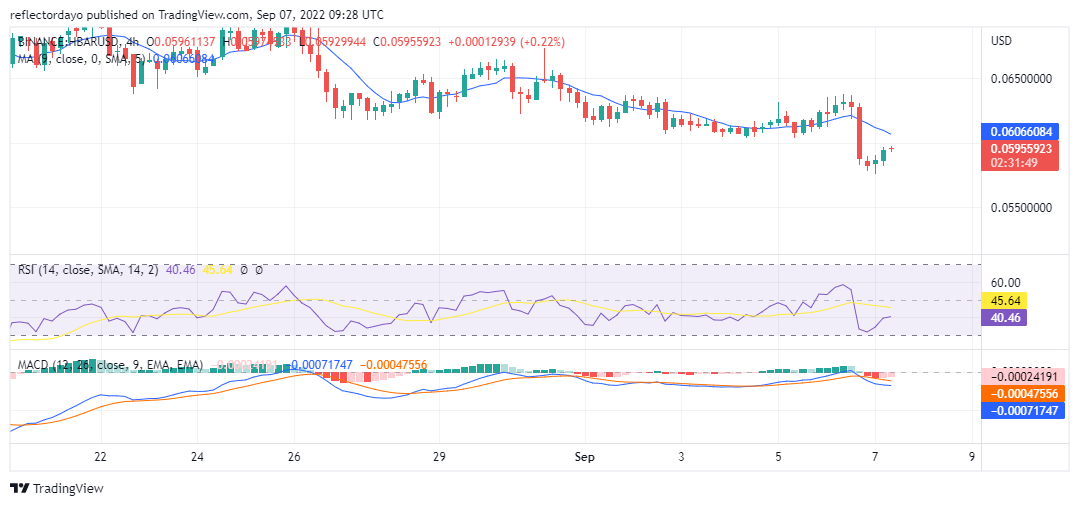
HBAR/USD 4-Hour Chart Outlook
In the first session Buyers had a very narrow win, but their second session was better. In the third session, the tug-of-war has kept the price static. In the RSI and MACD, price actions still remain in the downtrend territory. And for now, the indicators are not showing any sign that they are facing either up or down direction because market indesicion. More buyers are needed in the market
Related
Tamadoge – Play to Earn Meme Coin

- Earn TAMA in Battles With Doge Pets
- Capped Supply of 2 Bn, Token Burn
- NFT-Based Metaverse Game
- Presale Live Now – tamadoge.io
Join Our Telegram channel to stay up to date on breaking news coverage