
Join Our Telegram channel to stay up to date on breaking news coverage
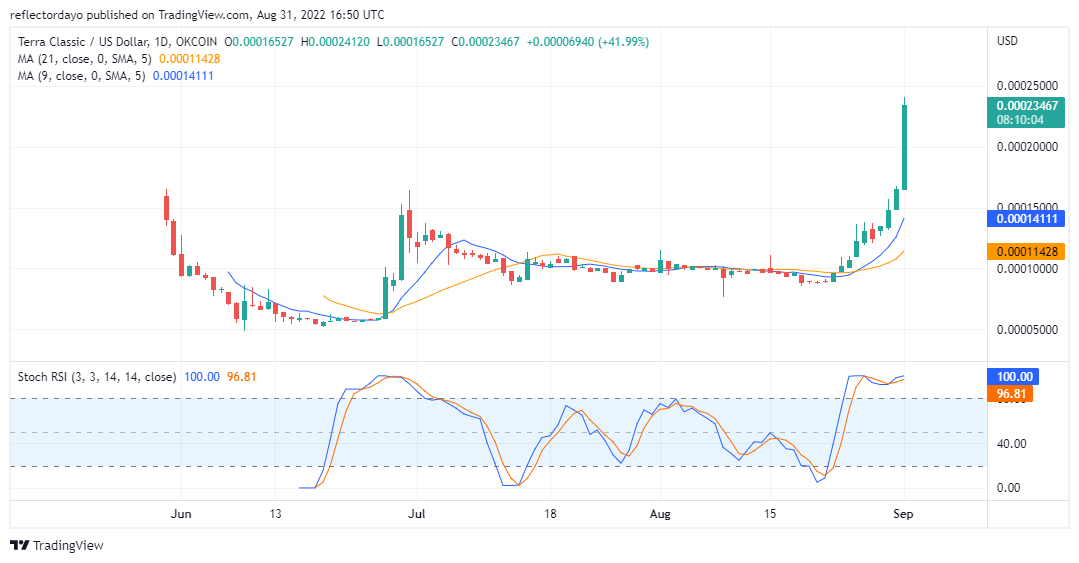
The buying pressure of Terra Classic has been increasing steadily, although, we expected that the price of the market should make a lower side retracement because it is in the overbought zone. Against expectations, strong buying pressure has kept Terra Classic ranging in the overbought zone. After the price consolidation that ranges from July to the middle of August, three consecutive bearish dojis (from the 20th to the 22nd) appeared to mark the end of the consolidation period. And this led to the bullish trend that has continued till today. The buying pressure appears to still be on the high side. And even after a brief retracement, the market may resume its upside performance.
Terra Classic Market Price Statistic:
- LUNC/USD price now: $0.00023467
- LUNC/USD market cap: $ 1,680,062,796
- LUNC/USD circulating supply: 6,584,000,000
- LUNC/USD total supply: 6,906,229,037,364
- LUNC/USD coin market ranking: #208
Key Levels
- Resistance: $0.00025000, $0.00027529, $0.0003000
- Support: $0.00016515, $0.00014797, $0.00013483
Your capital is at risk
Terra Classic Market Price Analysis: The Indicators Point of View
According to the Stochastic RSI indicator, price action has entered the overbought since the 25th of August. Although the fast and slow line of the indicator shows that the price is trying to correct itself, increasing demand for the market made it impossible. On the 27th of August, the faster line crossed the slower line. But, not long after that, the line recovered to its bullish position to signal the resumption of the uptrend. Looking at the chart again, we can see the faster line is preparing to cross the slower line again. If this signal did not turn out to be another fakeout, then the trend would change. The 21-day moving average is below the 9-day moving average and the price action is far above the two moving averages. This price behaviour means a very strong bullish momentum in the market.
Terra Classic Analysis: LUNC/USD 4-Hour Chart Outlook
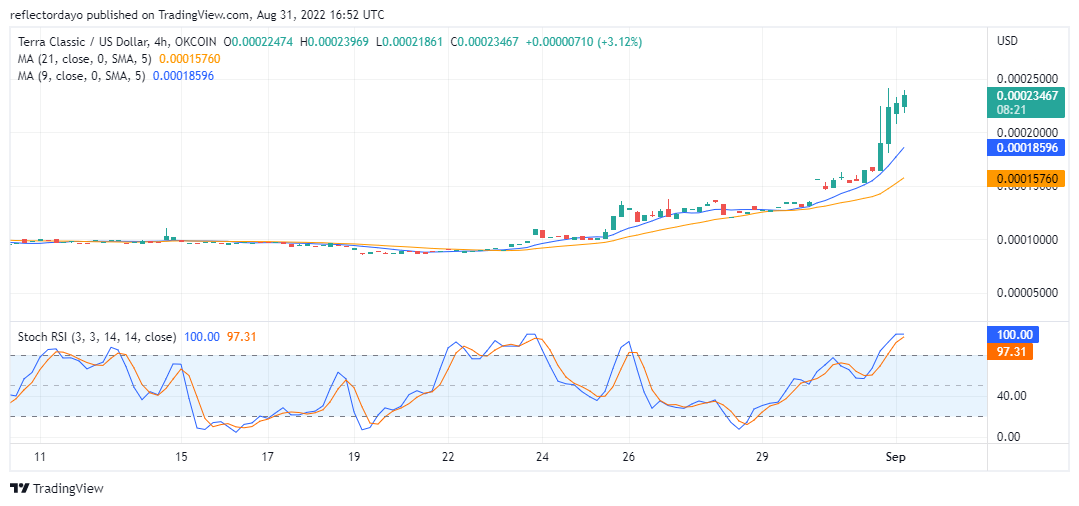
In this timeframe, we can see that the bullish momentum is reducing. However, the outlook of the candlesticks is still a strong one. In the Stochastic RSI, the faster line is showing signs that it will soon cross with the slow line. Yet the surest sentiment, for now, is that bullish momentum may continue. Investors should wait for confirmation of the direction of the trend before placing trades.
Related
Tamadoge – Play to Earn Meme Coin
- Earn TAMA in Battles With Doge Pets
- Capped Supply of 2 Bn, Token Burn
- NFT-Based Metaverse Game
- Presale Live Now – tamadoge.io
Join Our Telegram channel to stay up to date on breaking news coverage


