


Join Our Telegram channel to stay up to date on breaking news coverage
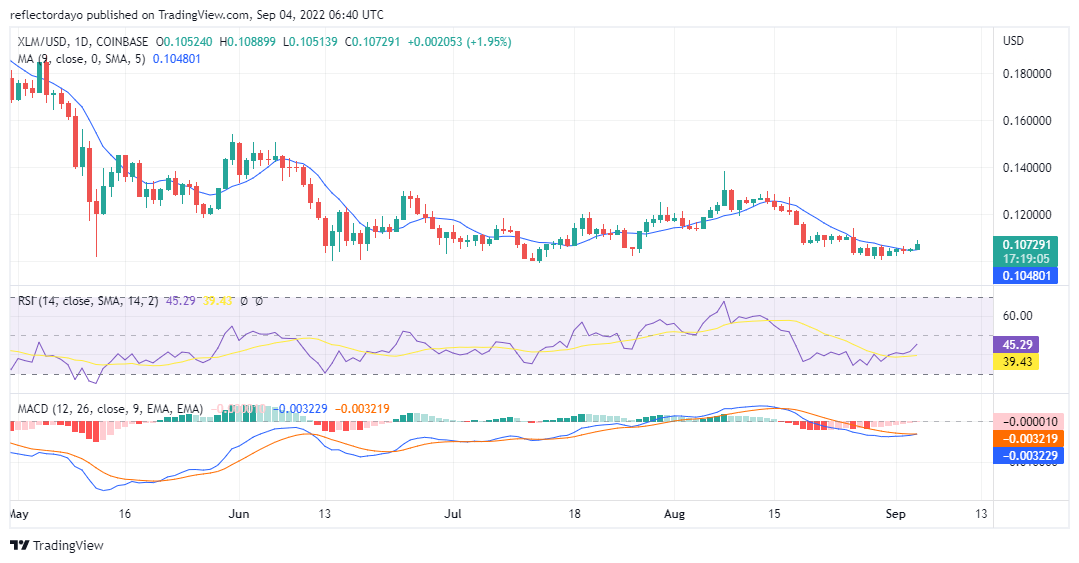
After an evenly matched market struggle between demand and supply that balanced the price of XLM/USD at around $0.104023, bulls finally become strong enough to push the price to its current price of $0.108166. Bullish moves in the market today look strong enough to recover from the downtrend. Strong bearish momentum has brought the price below the 9-day moving average and the 21-day moving. This confirms the downtrend. However, the buyers became strong enough to stop the retrogression of the price. The three consecutive candlesticks that preceded today’s market activities show that the two market players were evenly matched and none could be able to pull the price in his direction. But today’s market activities show that buyers have become stronger.
Stellar Market Price Statistic:
- XLM/USD price now: $0,108166
- XLM /USD market cap: $ 2,722,911,566
- XLM /USD circulating supply: 25.29 Billion
- XLM /USD total supply: 50,001,787,607
- XLM /USD coin market ranking: #28
Key Levels
- Resistance: $0.115526, $0.121442, $0.127029
- Support: $0.102380, $0.100408, $0.097450
Your capital is at risk

Stellar Market Price Analysis: The Indicators’ Point of View
Initially, the price is below the 21-day moving average and the 9-day moving average. The price of Stellar is ranging below those two moving averages. This confirms that the market is moving to the downside. Also, within the past four days, the RSI line has been steadily attempting to reach an upper level. Presently, RSI market strength is measured at 45% in the Relative Strength Index indicator. In the MACD indicator, the two lines appear to have touched each other and the value of the histogram that represents today’s marketing activities is exactly at point zero for now. From all the indicators, we conclude that the price of Stellar is just recovering from the previous downtrend.
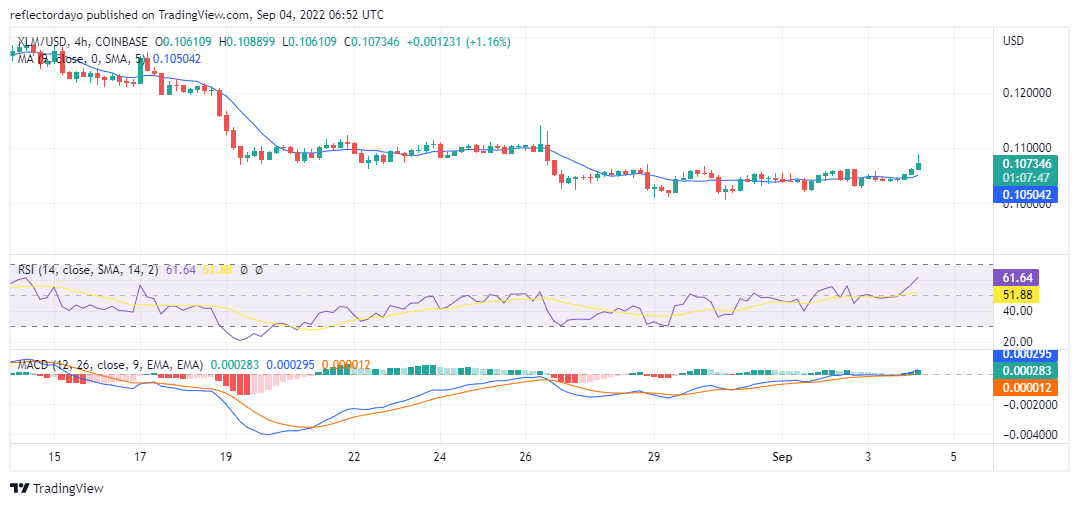
Stellar Analysis: XLM/USD 4-Hour Chart Outlook
The first session of this timeframe was almost a total bullish market, the sellers had no space in that session. But in the second session, their activities can now be felt in the market. However, the RSI indication for Stellar is now in the strong market zone measuring 61%. And the MACD histogram measures a difference of 0.000278 between the fast and slow lines. Stellar still has a long way to go.
Related
Tamadoge – Play to Earn Meme Coin

- Earn TAMA in Battles With Doge Pets
- Capped Supply of 2 Bn, Token Burn
- NFT-Based Metaverse Game
- Presale Live Now – tamadoge.io
Join Our Telegram channel to stay up to date on breaking news coverage